For additional statistics, download the full report
Market Overview
The Washington, DC office market saw a sharp reversal in Q2 2025, with net absorption plummeting to -1,010,852 square feet. This sharp decline effectively erased most of the gains made in the preceding two quarters. This reversal follows a period of modest momentum, with the market absorbing 367,616 square feet in Q1 2025 and 770,221 square feet in Q4 2024, together marking the first sustained positive run—over 1.1 million square feet combined—since 2022. As a result of this quarter’s contraction, the overall vacancy rate rose by 90 basis points, reaching 20.9%, up from 20.0% last quarter.Rental rates showed mixed trends. The overall average rate declined 0.05% quarter-over-quarter to $60.03 per square foot. Class A space averaged $63.05 per square foot, up 1.86% from last quarter, with Class B showing a slight increase of 0.22% to $50.09 per square foot. Trophy assets, however, showed a slight decrease of 0.21% from the previous quarter, reaching an average of $83.20 per square foot. Investment activity remained steady, underscoring continued interest in high-quality, well-located assets. Exelon acquired the 383,810-square-foot Class A building at 750 9th Street NW in the East End, where they currently occupy the whole building, for $175 million ($455.95 per square foot) from Brookfield. Easterly Government Properties purchased the 289,873-square-foot Class A property at 1200 1st Street NE, located in the NoMa, from Principal Real Estate Investors for nearly $119 million ($312.32 per square foot). Noteworthy lease transactions included the U.S. Department of Justice’s 402,787-square-foot renewal at 145 N Street NE in the NoMa submarket.
Quarterly Key Performance Indicators
- Net Absorption: (1,010,852) SF
- Direct Asking Rent: $60.03/SF
- Vacancy: 20.9%
Notable Regional Insights
- With the development pipeline at its lowest level in two decades, the market is experiencing a rare pause in new supply.
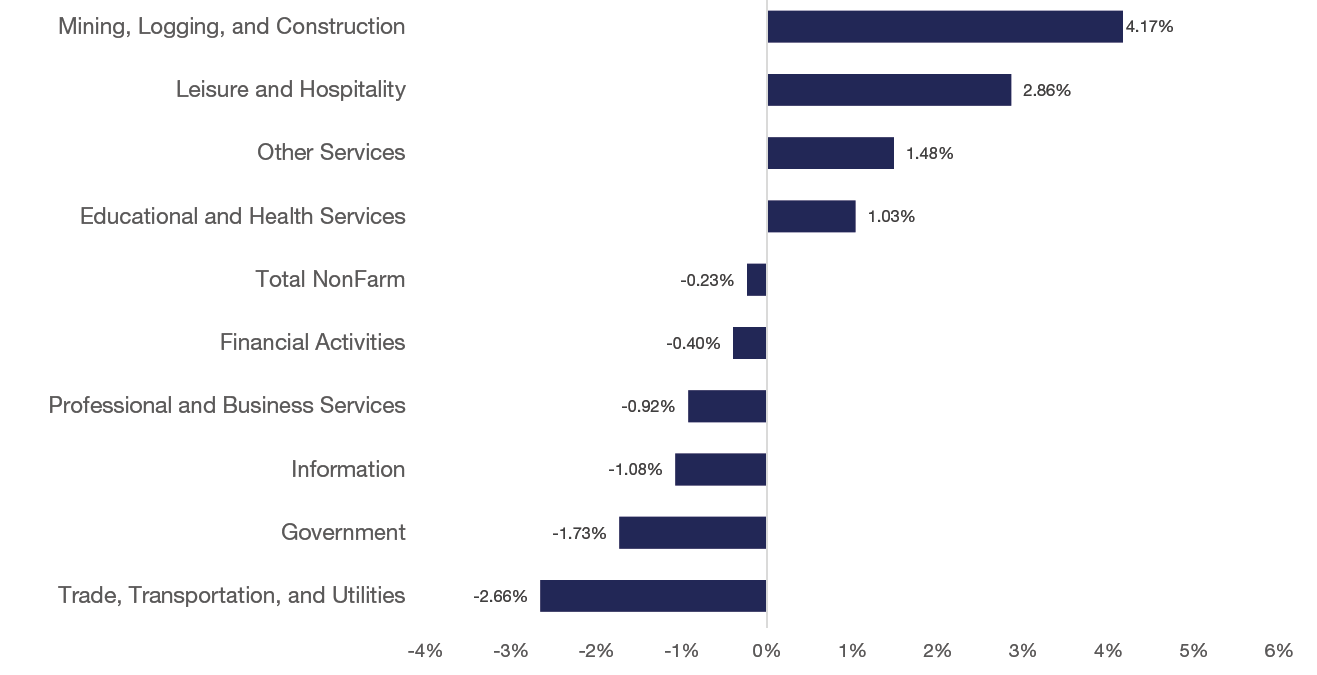
- Employment gains are tied largely to federally backed infrastructure and institutional projects, boosting construction jobs while office-occupying sectors lag.
Market Data
Occupancy Trends
The Washington, DC office market saw its recovery stall in Q2 2025, posting -1,010,852 square feet of net absorption. This follows positive absorption of 1,137,616 square feet over the previous two quarters, putting a halt to the first period of growth since late 2022. Trophy-class properties remained a bright spot, recording 63,438 square feet of positive absorption in Q2. However, both the CBD and East End, which were key drivers of growth last quarter, saw sharp reversals. Class A space in the East End recorded -411,405 square feet, while Class B properties in the CBD posted -165,783 square feet, both giving back much of their earlier gains. Overall, Class A posted -651,198 square feet, and Class B ended the quarter with -423,092 square feet of net absorption. The development pipeline remains at its lowest point in two decades, with no significant office deliveries anticipated this year. This will help ease some of the pent up pressure on vacancy rates from shifting tenant demand and evolving workplace strategies.

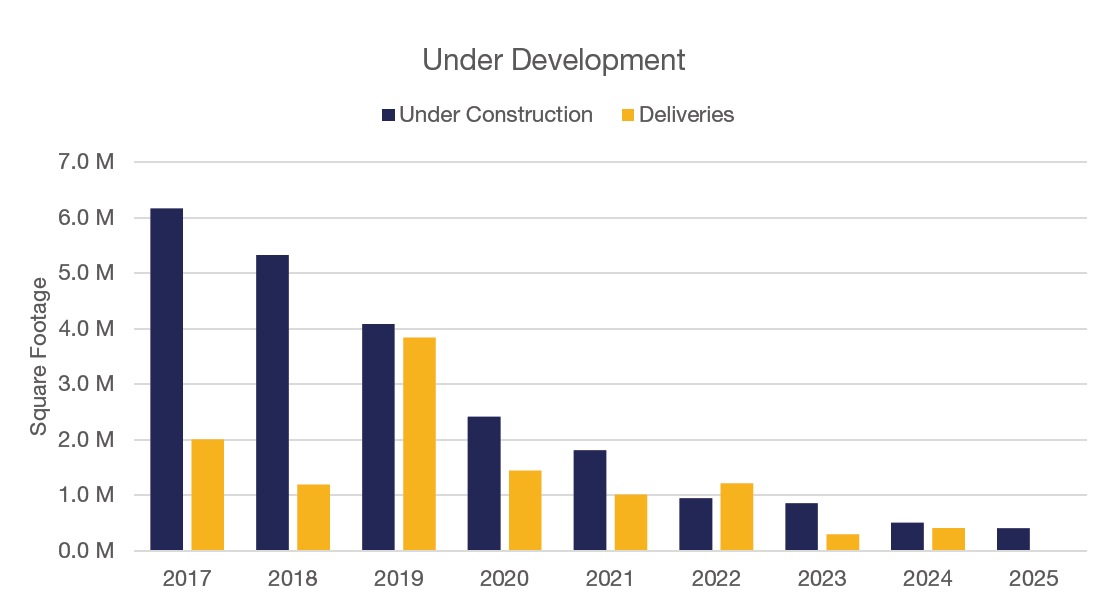
Construction Snapshot
Following nearly a decade of consistent development, the construction pipeline in the DC market has leveled off significantly. Lack of organic tenant demand, coupled with escalating construction costs and broader economic challenges, are key factors contributing to the slowdown in office projects. Notably, while new trophy deliveries have attracted greater leasing activity compared to existing buildings, the decline in new product coming to market may have a ripple effect on lower-class buildings as tenants reassess their relocation needs. In fact, no new construction projects were completed in the first quarter of 2025, and only ~400,000 square feet remains under development—a drastic drop from the peak in 2017, when over six million square feet were under construction. Stonebridge and Rockefeller Group’s 600 5th Street NW is currently the only project underway in Washington, DC. The redevelopment, 52% preleased to Crowell & Moring, is expected to be delivered in early 2026.
Market Vacancy
The flight-to-quality trend remains a defining feature of the Washington, D.C. office market, with trophy buildings continuing to outperform Class A and Class B properties. As of Q2 2025, trophy buildings reported a vacancy rate of 17.2%, up from 16.7% in Q1, reflecting a modest increase of 50 basis points. In contrast, Class A properties saw vacancy climb by 120 basis points to 21.0%, up from 19.8% last quarter, while Class B vacancies improved slightly, decreasing by 90 basis points to 22.3% from 23.2% in Q1. This sustained preference for high-quality, well-located office space underscores how tenants continue to prioritize modern, premium environments, even as broader market conditions fluctuate. The widening gap between trophy assets and the rest of the market highlights the enduring demand for top-tier buildings that best align with evolving workplace strategies.

Sublease Report
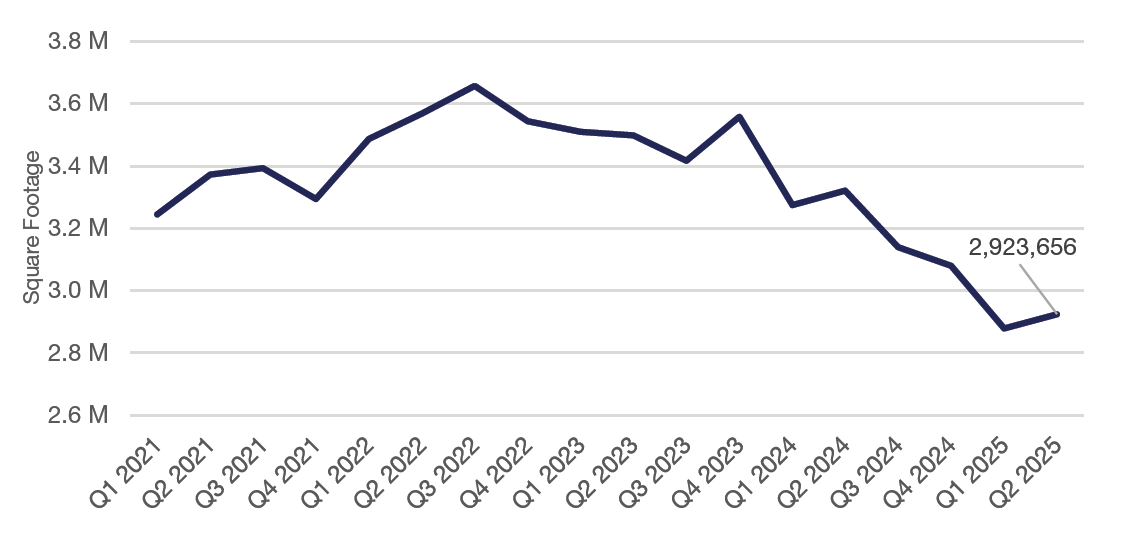
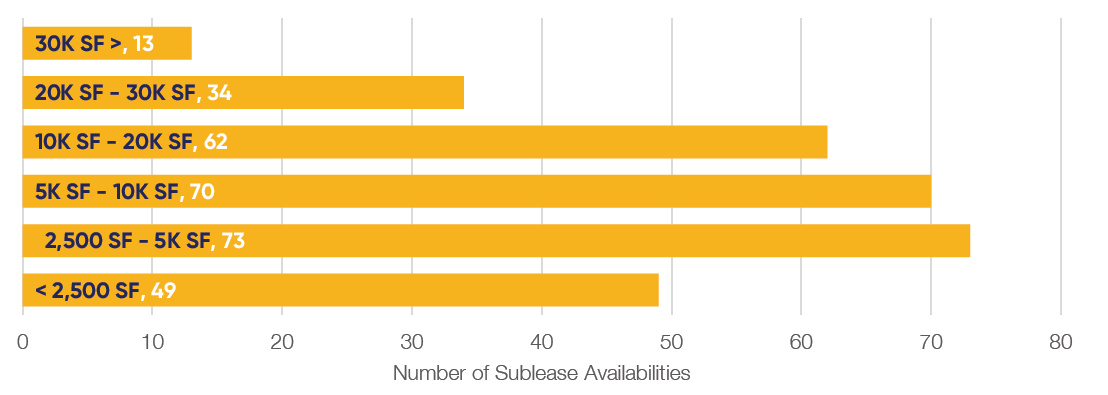
The sublease market in Washington, DC continues to play a significant role in the overall office market landscape. Currently, there are approximately 301 sublease spaces available across the District, totaling nearly 2.9 million square feet. Roughly 44% of these spaces range from 5,000 to 20,000 square feet, offering a variety of flexible options for tenants with diverse space requirements. The East End and Central Business District (CBD) remain the dominant areas, accounting for 65% of the total available sublease space.
Pricing for sublease spaces varies, with 36.5% of the current offerings asking between $35.00 and $55.00 per square foot. The majority of subleases in the market are priced at a significant discount compared to direct spaces, putting further pressure on landlords as they compete for tenants in the market. The breakdown of lease term lengths further reflects the market’s dynamics, with 70% of subleases offering terms of 5 years or less. These varied term lengths contribute to the flexibility tenants seek in the current market.
In terms of activity, The CBD saw some of the biggest gains in sublease space in Q2, with approximately 150,000 SF being added across 17 spaces. In the market overall, the amount of sublease space increased by approximately 45,000 SF, which reflects continued pressure even amidst natural sublease expirations and additional listings coming on market.
Change in Sublease Availability by Year
Distribution of Sublease Availabilities by SF
Economic Outlook
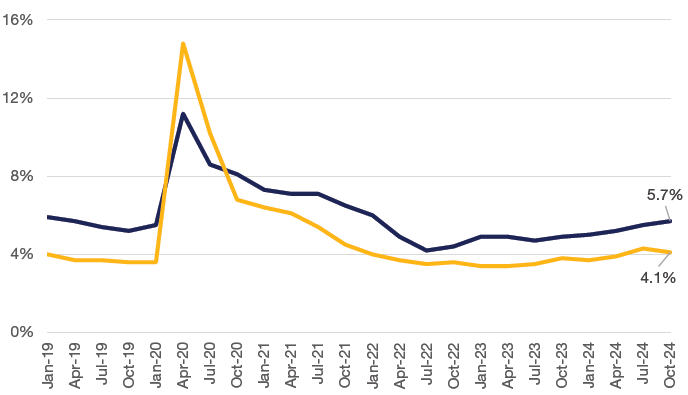
DC’s unemployment rate of 5.8% in Q2 2025, down from the 10-year average of 6.1%, reflects a steady recovery in the local labor market. The federal labor force concentrated in the District remains robust, however lasting hybrid work policies enacted by the government continue to hinder overall office occupancy and foot traffic in surrounding downtown retail.
Nationally, the USA’s unemployment rate of 4.2% similarly falls below its 10-year average of 4.7%. While this signals economic stability, inflation remains a concern, with DC’s 12-month CPI change at 2.4%. With costs of goods higher, compounded by elevated labor and construction costs, companies are more prone to make cost-conscious decisions as it relates to their real estate needs.
Unemployment Rate
Employment Growth by Industry, 12-Month % Change, January 2025
Download the full report to learn more.