What are employee preference metrics?
Employee preference metrics are collections of data that organizations can use to make informed decisions regarding their workplace and employees.
Leveraging our proprietary Workforce Analytics tool, Cresa’s Workplace Solutions team has worked with hundreds of organizations assisting leadership teams to paint a clear picture of how their space is being utilized and asking the questions needed to fully understand how their employees work and what their preferences are.
After seeing their own workplace results, 96% of surveyed organizations come to a decision. Allowing them to move forward with making positive impacts on both their real estate portfolios and their people.
What can employee work preferences tell us about the future of work?
Job growth has slowed with fears of a looming recession and a handful of tech industry layoff announcements, yet many employers continue to feel the pressure of the resilient labor market, with two job openings being reported for every job seeker.
With the steady demand for talent, recruiting and retaining employees will continue to be a top concern, which brings us to why understanding your employees’ work preferences is so critical for your company’s ability to recruit and retain talent.
Broader trends across industries and locations can tell us how the landscape may change in years to come.
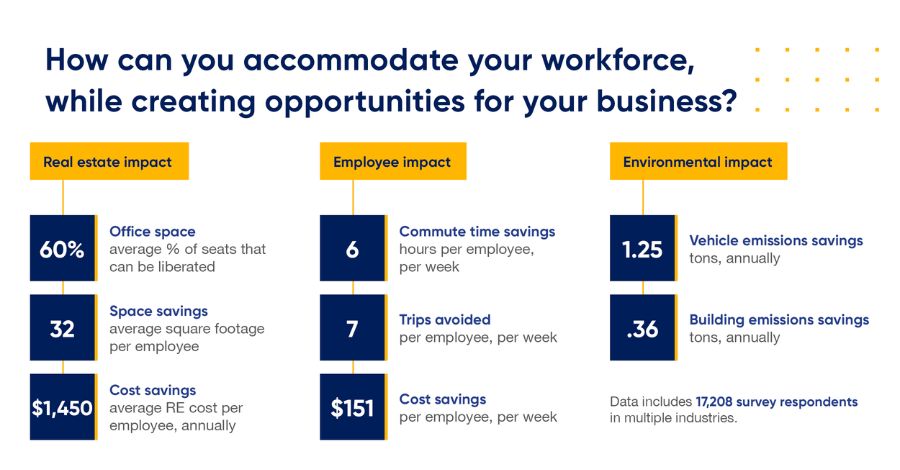
Here is what more than 17,000 survey respondents from a variety of industries have told us.
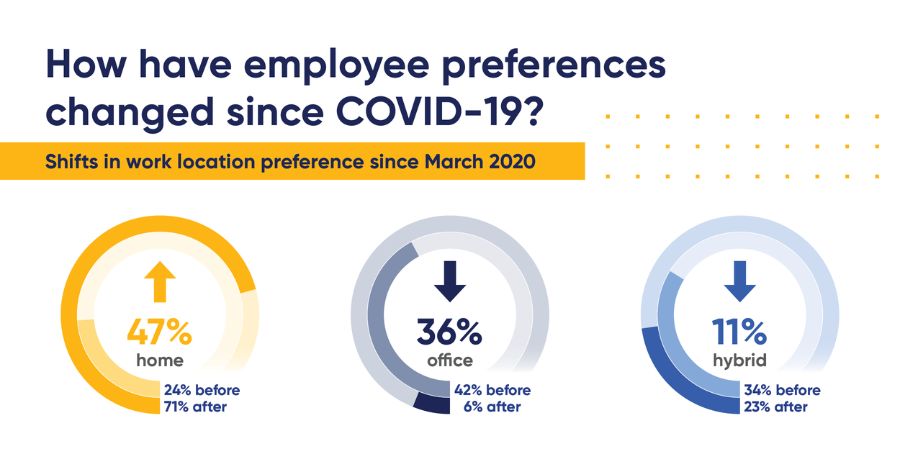
Since March of 2020, we have seen a 47% increase in employees who prefer to work from home. At the same time, both preferences for working from an office and hybrid work schedules have declined.
This tells us that though leadership teams may be pushing to get people back to the office, work-from-home options appear to be here to stay.
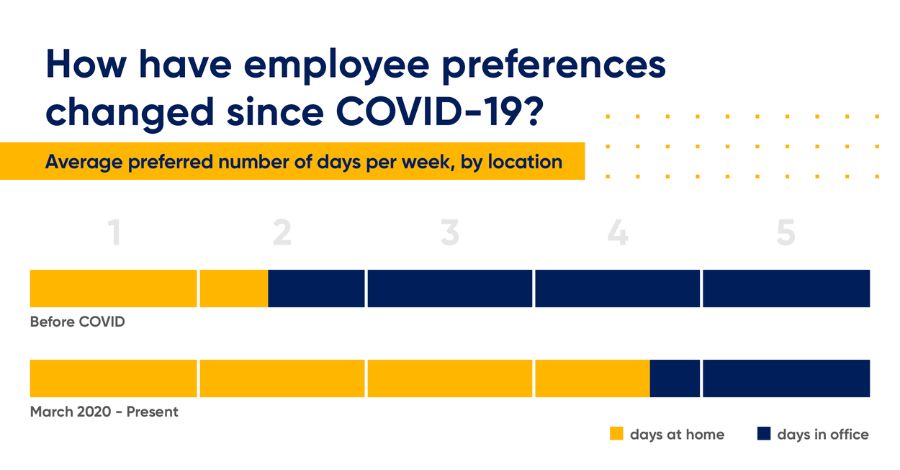
Many companies have opted for a hybrid work schedule as a compromise. When employees were asked, the preference for the number of days in the office in a hybrid scenario went down by two days.
So not only has the preference for hybrid scheduling declined, but the number of days people want to be in the office has also declined.
Followed by real estate expenses, people remain the number one expense for most companies. We all know turnover is costly. But is it possible to accommodate the increased preference for flexibility without sacrificing productivity or increasing operating expenses?
If your employees fall in line with the trends we are seeing nationally, it can not only be done but it can be done in a way that saves you money, gives your employees what they want and reduces your environmental footprint in the process.
When space utilization is studied, companies on average have 60% more space than they need. This could translate to an average savings of $1,450 per employee. While saving your employees $151 per week and reducing vehicle emissions by 1.25 tons annually.
If you are curious about a personalized space utilization study, capturing your own employee preference metrics, or learning how much your excess space is costing you, let’s talk. Cresa’s team of workplace experts is here to help your employees thrive, and to help save you money in the process.
Click here to download the full infographic of the charts above.
Related
posts
-
 Blog
BlogSell Smarter, Not Harder: Is Your Office Fueling or Draining Your Revenue?
This is Part 1 of a series exploring the intersection of workplace design and sales performance.
December 4, 2025 -

-
